
High-Income Havens: The 50 Wealthiest Suburbs in the U.S. for Ultra-Affluent Families
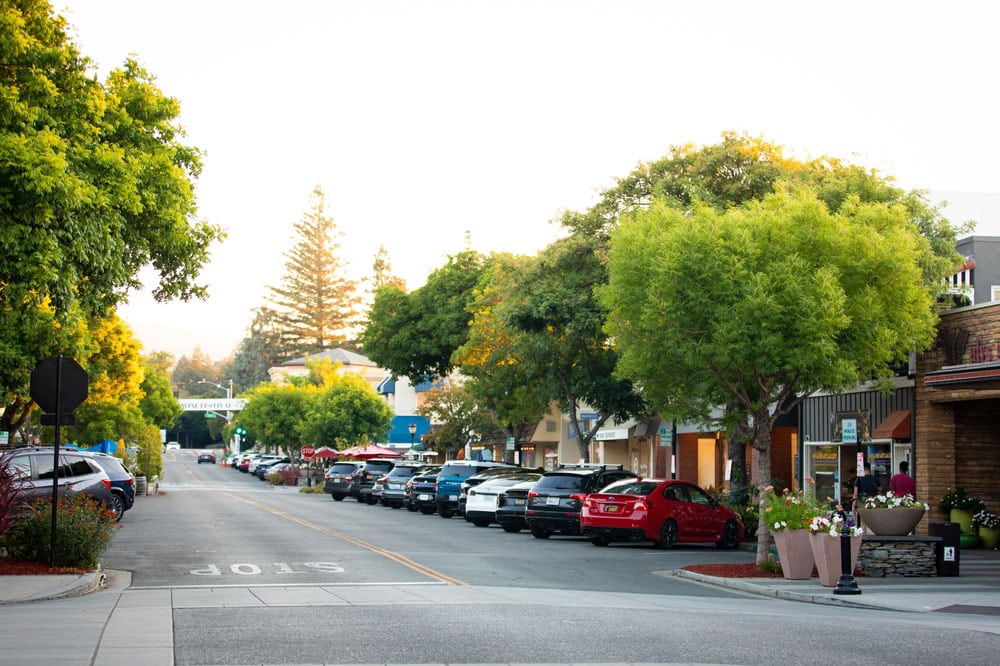
America’s 50 Wealthiest Suburbs Ranked: The geography of American wealth is not confined to glittering urban centers or iconic financial districts. Increasingly, the true enclaves of prosperity are found just outside major cities, in leafy suburbs that blend exclusivity, top-tier schools, and luxury real estate. According to the latest analysis of the U.S. Census Bureau’s 2023 American Community Survey, the wealthiest suburbs in America have been revealed — and Scarsdale, New York, once again takes the crown.
With an average household income of $601,193 in 2023 — a 2.2 percent increase over the prior year — Scarsdale exemplifies the enduring allure of Westchester County’s most prestigious neighborhood. Home values tell a similar story: by May 2025, the median price reached $1.2 million, underscoring the suburb’s resilience in a shifting real estate market. For C-suite executives, hedge fund partners, and private equity leaders who call Scarsdale home, it remains a sanctuary of financial stability and long-term value.
Just down the Metro-North line, Rye, New York, follows closely behind. With an average household income of $421,259, Rye demonstrates that affluent living in the New York metro area extends well beyond Manhattan’s elite addresses. Housing prices here surged 4.4 percent year-over-year, pushing values to nearly $1.9 million by mid-2025. Rye’s reputation for waterfront estates, strong schools, and proximity to Manhattan continues to attract ultra-high-net-worth families seeking both luxury and lifestyle.
Wealthiest Suburbs in America, 2025
| City | Suburb of | Average household income 2023 | Average household income 2022 | 2022-2023 one-year income change (%) | Home Value May 2025 | Home Value May 2024 | 2024-2025 home value change (%) |
|---|---|---|---|---|---|---|---|
| Scarsdale, New York | New York City | 601193 | 588014 | 2.20% | 1207528 | 1170138 | 3.20% |
| Rye, New York | New York City | 421259 | 418653 | 0.60% | 1875248 | 1796232 | 4.40% |
| West University Place, Texas | Houston | 409677 | 417382 | -1.90% | 982834 | 939538 | 4.60% |
| Los Altos, California | San Jose, California | 403512 | 414253 | -2.60% | 4562702 | 4302208 | 6.10% |
| Alamo, California | Oakland, California | 403334 | 398905 | 1.10% | 2550706 | 2598591 | -1.80% |
| University Park, Texas | Dallas | 389868 | 394014 | -1.10% | 2456871 | 2340582 | 5% |
| Southlake, Texas | Fort Worth, Texas | 382520 | 372148 | 2.80% | 1290325 | 1257925 | 2.60% |
| Hinsdale, Illinois | Chicago | 376366 | 393233 | -4.30% | 1234894 | 1144821 | 7.90% |
| Orinda, California | Oakland, California | 369073 | 382613 | -3.50% | 1993154 | 2019537 | -1.30% |
| Wellesley, Massachusetts | Boston | 368179 | 380130 | -3.10% | 2079414 | 2001266 | 3.90% |
| Palos Verdes Estates, California | Los Angeles | 367178 | 353943 | 3.70% | 2800352 | 2784529 | 0.60% |
| McLean, Virginia | Washington, D.C. | 364591 | 376298 | -3.10% | 1741410 | 1633896 | 6.60% |
| Palm Beach, Florida | Fort Lauderdale, Florida | 356467 | 378259 | -5.80% | 10310928 | 10556860 | -2.30% |
| Saratoga, California | San Jose, California | 344319 | 340175 | 1.20% | 4118931 | 3887600 | 6% |
| Menlo Park, California | San Jose, California | 339415 | 327196 | 3.70% | 2960270 | 2805030 | 5.50% |
| San Carlos, California | San Francisco | 335300 | 308400 | 8.70% | 2524724 | 2404205 | 5% |
| Lafayette, California | Oakland, California | 319744 | 322699 | -0.90% | 1974136 | 2009694 | -1.80% |
| Los Gatos, California | San Jose, California | 317745 | 315899 | 0.60% | 2787130 | 2679568 | 4% |
| La Cañada Flintridge, California | Los Angeles | 316810 | 321370 | -1.40% | 2450111 | 2401095 | 2% |
| Wolf Trap, Virginia | Washington, D.C. | 316271 | 311906 | 1.40% | 1196770 | 1145448 | 4.50% |
| Pinecrest, Florida | Miami | 312591 | 314620 | -0.70% | 2398740 | 2402543 | -0.20% |
| Coto de Caza, California | Irvine, California | 312324 | 316141 | -1.20% | 2167716 | 2030982 | 6.70% |
| Bellaire, Texas | Houston | 311033 | 304481 | 2.20% | 1132863 | 1083298 | 4.60% |
| Palo Alto, California | San Francisco | 308837 | 311323 | -0.80% | 3833432 | 3695800 | 3.70% |
| Mill Valley, California | San Francisco | 308154 | 313801 | -1.80% | 2122176 | 2177206 | -2.50% |
| Tenafly, New Jersey | New York City | 306103 | 300854 | 1.70% | 1277783 | 1229706 | 3.90% |
| Potomac, Maryland | Washington, D.C. | 304509 | 297569 | 2.30% | 1417246 | 1371062 | 3.40% |
| Summit, New Jersey | New York City | 304408 | 301281 | 1% | 1340832 | 1272756 | 5.40% |
| Mercer Island, Washington | Seattle | 303425 | 300398 | 1% | 2507485 | 2410321 | 4% |
| Mountain Brook, Alabama | Birmingham, Alabama | 302510 | 276298 | 9.50% | 1037577 | 1001510 | 3.60% |
| Lake Forest, Illinois | Chicago | 302171 | 294330 | 2.70% | 1185363 | 1117248 | 6.10% |
| Lexington, Massachusetts | Boston | 300716 | 290613 | 3.50% | 1691412 | 1673820 | 1.10% |
| Westfield, New Jersey | New York City | 297367 | 291182 | 2.10% | 1237808 | 1185081 | 4.50% |
| Greenwich, Connecticut | New York City | 297081 | 285614 | 4% | 2444110 | 2398091 | 2% |
| Winchester, Massachusetts | Boston | 296327 | 293140 | 1.10% | 1716547 | 1685502 | 1.80% |
| Cupertino, California | San Jose, California | 295739 | 292552 | 1.10% | 3270351 | 3095627 | 5.60% |
| Wilmette, Illinois | Chicago | 291930 | 282893 | 3.20% | 999547 | 936005 | 6.80% |
| Bethesda, Maryland | Washington, D.C. | 290678 | 291025 | -0.10% | 1334020 | 1289680 | 3.40% |
| Manhattan Beach, California | Los Angeles | 290648 | 289872 | 0.30% | 3060289 | 3061514 | -0.04% |
| Lake Butler, Florida | Orlando, Florida | 289593 | 278972 | 3.80% | 283493 | 282374 | 0.40% |
| Ridgewood, New Jersey | New York City | 288861 | 286728 | 0.70% | 1174405 | 1090022 | 7.70% |
| Danville, California | Oakland, California | 284183 | 272988 | 4.10% | 2028939 | 2067645 | -1.90% |
| Needham, Massachusetts | Boston | 281049 | 276933 | 1.50% | 1586378 | 1568936 | 1.10% |
| Sammamish, Washington | Seattle | 280644 | 270527 | 3.70% | 1775255 | 1677194 | 5.90% |
| Vienna, Virginia | Washington, D.C. | 273768 | 274652 | -0.30% | 1206800 | 1147636 | 5.20% |
| Dix Hills, New York | New York City | 270581 | 271530 | -0.40% | 1107409 | 977324 | 13.30% |
| Colleyville, Texas | Fort Worth, Texas | 265831 | 264414 | 0.50% | 923032 | 907939 | 1.70% |
| Moraga, California | Oakland, California | 262781 | 268166 | -2% | 1771189 | 1839305 | -3.70% |
| Newton, Massachusetts | Boston | 261666 | 259631 | 0.80% | 1745616 | 1720939 | 1.40% |
| Brentwood, Tennessee | Nashville, Tennessee | 261248 | 260318 | 0.40% | 1419146 | 1347813 | 5.30% |
The Metrics Behind the Rankings
To qualify for inclusion, suburbs were required to have at least 5,000 households and be located within a metropolitan area, though not the principal city itself. Researchers examined average household income growth between 2022 and 2023 and paired it with home value performance through May 2025. This dual analysis provides a comprehensive snapshot of both earning power and real estate appreciation, two key benchmarks for wealth preservation and growth.
The result is a revealing portrait of the communities where America’s wealthiest individuals are choosing to live, raise families, and invest in real estate. The ranking highlights not just income, but also the durability of property values — a critical factor in net worth preservation for executives, entrepreneurs, and global investors.
Beyond New York: A Coast-to-Coast Map of Affluence
While New York suburbs dominate the list, wealth is far from geographically concentrated. On the West Coast, Los Altos, California — a Silicon Valley enclave near San Jose — posted an average income of $403,512. Although earnings dipped 2.6 percent year-over-year, real estate values soared, with home prices climbing 6.1 percent to $4.56 million. This illustrates a defining trend: in tech-driven economies, property appreciation often outpaces even high household incomes.
Neighboring Silicon Valley cities such as Saratoga, Menlo Park, San Carlos, and Palo Alto also made the top 50, reflecting the gravitational pull of technology wealth. In Palo Alto, for example, average household income reached $308,837, while home values climbed to $3.83 million — cementing its position as one of America’s most desirable markets for founders, VCs, and executives.
Texas, meanwhile, has emerged as a formidable competitor in the wealth map. Suburbs like West University Place (Houston), University Park (Dallas), and Southlake (Fort Worth) reported average household incomes between $382,000 and $410,000, with property values consistently appreciating between 2.6 and 5 percent. This underscores Texas’ growing role as a magnet for corporate relocations, family offices, and wealth migration from coastal states.
In the Midwest, Hinsdale, Illinois and Lake Forest, Illinois hold their own, with incomes exceeding $300,000 and real estate prices appreciating as much as 7.9 percent in 2025. Their proximity to Chicago, coupled with historic estates and community prestige, continues to anchor them among the most desirable enclaves for executives.
Florida and the Southeast: Luxury by the Water
The analysis also points to the rising influence of Florida and the Southeast. Palm Beach tops the list for sheer property value, with median home prices above $10.3 million despite a modest 2.3 percent decline year-over-year. The enclave remains synonymous with ultra-luxury, drawing hedge fund billionaires, private equity leaders, and international investors.
Elsewhere in Florida, communities like Pinecrest (Miami) and Lake Butler (Orlando) have become magnets for executives seeking sunshine, favorable tax environments, and access to growing business hubs. While Pinecrest saw a marginal decline in home values, Lake Butler posted modest growth, reflecting stability in Florida’s luxury housing market.
Washington, D.C. Beltway Wealth
Suburbs around the nation’s capital also feature prominently. McLean, Virginia, long known for its proximity to both Capitol Hill and the CIA, posted an average household income of $364,591, with home values surging 6.6 percent in 2025. Other affluent D.C. suburbs such as Bethesda, Wolf Trap, Vienna, and Potomac highlight the concentration of political, legal, and corporate wealth that anchors the region.
Key Takeaways for the C-Suite
For CEOs, private equity investors, and wealth managers, this ranking offers more than trivia — it provides a blueprint of where America’s economic elite are concentrating their resources. Several trends stand out:
- Real estate resilience matters. Communities with strong home value appreciation, such as Los Altos, McLean, and Hinsdale, underscore the importance of location in preserving generational wealth.
- Income growth varies widely. While Mountain Brook, Alabama, saw a 9.5 percent jump in income, other affluent suburbs such as Hinsdale and Palm Beach registered declines, signaling the importance of diversification.
- Migration reshapes wealth maps. Texas and Florida suburbs are capturing significant inflows of high-net-worth families, balancing historic centers of wealth in New York and California.
The Bigger Picture
America’s wealthiest suburbs remain a window into the financial health of the ultra-affluent. They reflect not only where wealth is concentrated but also how it adapts to changing economic and real estate cycles. For business leaders, investors, and policymakers, the suburbs on this list serve as indicators of both opportunity and resilience in a dynamic economy.
Scarsdale may top the list in 2025, but the broader story is clear: from Silicon Valley to Palm Beach, and from Dallas to Washington, D.C., the geography of American affluence is evolving — and the competition for luxury, stability, and prestige has never been stronger.
Have you read?
The Citizenship by Investment (CBI) Index evaluates the performance of the 11 nations currently offering operational Citizenship By Investment (CBI) programs: St Kitts and Nevis (Saint Kitts and Nevis), Dominica, Grenada, Saint Lucia (St. Lucia), Antigua & Barbuda, Nauru, Vanuatu, Türkiye (Turkey), São Tomé and Príncipe, Jordan, and Egypt.
Add CEOWORLD magazine as your preferred news source on Google News
Follow CEOWORLD magazine on: Google News, LinkedIn, Twitter, and Facebook.License and Republishing: The views in this article are the author’s own and do not represent CEOWORLD magazine. No part of this material may be copied, shared, or published without the magazine’s prior written permission. For media queries, please contact: info@ceoworld.biz. © CEOWORLD magazine LTD


