
Where Affluence Meets Safety: The Best U.S. Cities to Live in 2025
Safest and Richest U.S. Cities To Live in 2025: For high-net-worth individuals, safety and prosperity are two inseparable priorities. A thriving community is not only measured by its wealth but also by its ability to protect that wealth, foster family life, and provide long-term stability. CEOWORLD magazine’s original 2025 research highlights the 50 safest and richest U.S. cities, ranking them based on a blend of financial and quality-of-life indicators that matter most to executives, investors, and decision-makers.
The study analyzed the top 1,000 U.S. cities by household mean income, as reported by the U.S. Census Bureau’s American Community Survey. From there, a shortlist of the top 50 was created using a composite of household mean income, single-family home values, annual cost of living, and both property and violent crime rates. The result is a definitive guide to the places where affluence and security converge, making them attractive not only for family living but also for wealth preservation.
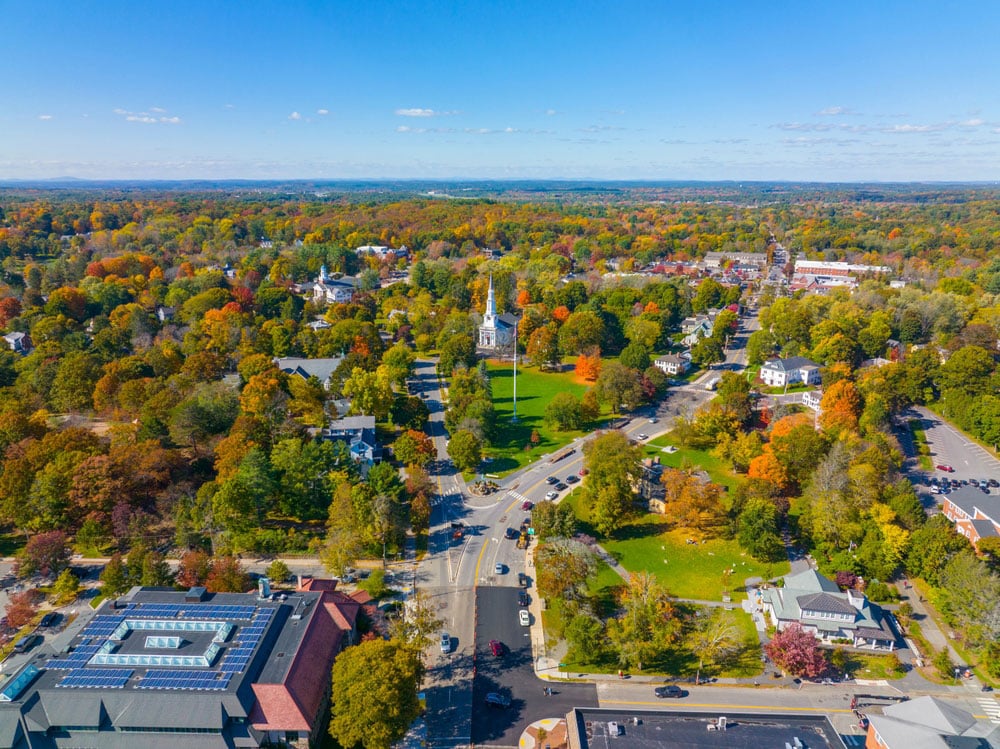
Western Springs, Illinois: The Benchmark for 2025
At the top of the list is Western Springs, Illinois, a perennial leader that embodies both financial strength and safety. As of 2025, the household mean income is $294,896, while the average single-family home is valued at $837,238. The annual cost of living, at $84,810, is relatively moderate compared to coastal enclaves of similar wealth. What truly sets Western Springs apart, however, is its exceptional safety profile. With a property crime rate of just 2.657 per 1,000 residents and a violent crime rate of 0.076, it ranks as one of the most secure communities in the nation.
For executives balancing corporate responsibilities with family priorities, Western Springs represents the gold standard: high incomes, valuable homes, and peace of mind.
East Coast Strength: Massachusetts and New Jersey
The East Coast continues to dominate the affluent and secure landscape, with Lexington, Winchester, and Wellesley, Massachusetts, all securing top positions. Lexington leads with a household mean income of $300,716 and average home values approaching $1.7 million. Winchester follows closely with incomes of $296,327 and even higher property values, while Wellesley distinguishes itself with home values surpassing $2 million and household incomes of $368,179.
New Jersey also features prominently, with suburbs such as Westfield, Summit, Madison, and Ridgewood ranking high. Each boasts incomes near or above $290,000, with property values in the $1.1–1.3 million range. Notably, crime rates in these communities remain low, reinforcing their appeal as safe havens for finance professionals, hedge fund managers, and executives commuting into New York City.
Midwest Hubs of Prosperity
Affluence in the Midwest extends well beyond Western Springs. Communities like Winnetka and Kenilworth, Illinois, showcase household mean incomes of $457,404 and $460,411, respectively, placing them among the wealthiest suburbs in the nation. Home values here exceed $1.8 million, with Kenilworth nearing the $2 million mark. Despite their wealth, both maintain impressively low crime rates, a testament to community investment and effective governance.
Other Midwest leaders include Hinsdale, Deerfield, and Wilmette, Illinois, as well as Huntington Woods and Birmingham, Michigan. These cities demonstrate that wealth is not confined to the coasts — the Midwest’s legacy of financial discipline and community safety has created some of the most livable environments for executives and their families.
The Washington Corridor
The suburbs of Washington, D.C., also feature prominently in the 2025 ranking. Communities like Vienna, Virginia, and Purcellville, Virginia, combine strong income levels — $273,768 and $189,791, respectively — with relatively low violent crime rates. Similarly, University Park, Maryland, while posting slightly higher property crime rates, remains a highly attractive enclave with mean household income nearing $240,000.
The Washington corridor’s mix of political influence, professional services, and security makes these cities ideal for policymakers, lobbyists, and executives tied to federal contracting and advisory work.
The Western Edge: California and Washington
On the West Coast, safety and prosperity align in affluent communities such as Mill Valley, California, and Sammamish, Washington. Mill Valley’s average household income is $308,154, paired with home values exceeding $2.1 million. Sammamish, with incomes averaging $280,644 and property values of $1.75 million, offers an equally strong case for ultra-affluent families.
Other notable entries include Lafayette and Brookline, Massachusetts, as well as University Park, Texas, where household mean income stands at $389,868, the highest in the 2025 ranking. With homes averaging $2.43 million and crime rates well below national averages, University Park underscores Texas’ growing reputation as a magnet for wealth.
Safest and Richest US Cities To Live in 2025
| City | Suburb of | Average household income 2023 | Average household income 2022 | 2022-2023 one-year income change (%) | Home Value May 2025 | Home Value May 2024 | 2024-2025 home value change (%) |
|---|---|---|---|---|---|---|---|
| Scarsdale, New York | New York City | 601193 | 588014 | 2.20% | 1207528 | 1170138 | 3.20% |
| Rye, New York | New York City | 421259 | 418653 | 0.60% | 1875248 | 1796232 | 4.40% |
| West University Place, Texas | Houston | 409677 | 417382 | -1.90% | 982834 | 939538 | 4.60% |
| Los Altos, California | San Jose, California | 403512 | 414253 | -2.60% | 4562702 | 4302208 | 6.10% |
| Alamo, California | Oakland, California | 403334 | 398905 | 1.10% | 2550706 | 2598591 | -1.80% |
| University Park, Texas | Dallas | 389868 | 394014 | -1.10% | 2456871 | 2340582 | 5% |
| Southlake, Texas | Fort Worth, Texas | 382520 | 372148 | 2.80% | 1290325 | 1257925 | 2.60% |
| Hinsdale, Illinois | Chicago | 376366 | 393233 | -4.30% | 1234894 | 1144821 | 7.90% |
| Orinda, California | Oakland, California | 369073 | 382613 | -3.50% | 1993154 | 2019537 | -1.30% |
| Wellesley, Massachusetts | Boston | 368179 | 380130 | -3.10% | 2079414 | 2001266 | 3.90% |
| Palos Verdes Estates, California | Los Angeles | 367178 | 353943 | 3.70% | 2800352 | 2784529 | 0.60% |
| McLean, Virginia | Washington, D.C. | 364591 | 376298 | -3.10% | 1741410 | 1633896 | 6.60% |
| Palm Beach, Florida | Fort Lauderdale, Florida | 356467 | 378259 | -5.80% | 10310928 | 10556860 | -2.30% |
| Saratoga, California | San Jose, California | 344319 | 340175 | 1.20% | 4118931 | 3887600 | 6% |
| Menlo Park, California | San Jose, California | 339415 | 327196 | 3.70% | 2960270 | 2805030 | 5.50% |
| San Carlos, California | San Francisco | 335300 | 308400 | 8.70% | 2524724 | 2404205 | 5% |
| Lafayette, California | Oakland, California | 319744 | 322699 | -0.90% | 1974136 | 2009694 | -1.80% |
| Los Gatos, California | San Jose, California | 317745 | 315899 | 0.60% | 2787130 | 2679568 | 4% |
| La Cañada Flintridge, California | Los Angeles | 316810 | 321370 | -1.40% | 2450111 | 2401095 | 2% |
| Wolf Trap, Virginia | Washington, D.C. | 316271 | 311906 | 1.40% | 1196770 | 1145448 | 4.50% |
| Pinecrest, Florida | Miami | 312591 | 314620 | -0.70% | 2398740 | 2402543 | -0.20% |
| Coto de Caza, California | Irvine, California | 312324 | 316141 | -1.20% | 2167716 | 2030982 | 6.70% |
| Bellaire, Texas | Houston | 311033 | 304481 | 2.20% | 1132863 | 1083298 | 4.60% |
| Palo Alto, California | San Francisco | 308837 | 311323 | -0.80% | 3833432 | 3695800 | 3.70% |
| Mill Valley, California | San Francisco | 308154 | 313801 | -1.80% | 2122176 | 2177206 | -2.50% |
| Tenafly, New Jersey | New York City | 306103 | 300854 | 1.70% | 1277783 | 1229706 | 3.90% |
| Potomac, Maryland | Washington, D.C. | 304509 | 297569 | 2.30% | 1417246 | 1371062 | 3.40% |
| Summit, New Jersey | New York City | 304408 | 301281 | 1% | 1340832 | 1272756 | 5.40% |
| Mercer Island, Washington | Seattle | 303425 | 300398 | 1% | 2507485 | 2410321 | 4% |
| Mountain Brook, Alabama | Birmingham, Alabama | 302510 | 276298 | 9.50% | 1037577 | 1001510 | 3.60% |
| Lake Forest, Illinois | Chicago | 302171 | 294330 | 2.70% | 1185363 | 1117248 | 6.10% |
| Lexington, Massachusetts | Boston | 300716 | 290613 | 3.50% | 1691412 | 1673820 | 1.10% |
| Westfield, New Jersey | New York City | 297367 | 291182 | 2.10% | 1237808 | 1185081 | 4.50% |
| Greenwich, Connecticut | New York City | 297081 | 285614 | 4% | 2444110 | 2398091 | 2% |
| Winchester, Massachusetts | Boston | 296327 | 293140 | 1.10% | 1716547 | 1685502 | 1.80% |
| Cupertino, California | San Jose, California | 295739 | 292552 | 1.10% | 3270351 | 3095627 | 5.60% |
| Wilmette, Illinois | Chicago | 291930 | 282893 | 3.20% | 999547 | 936005 | 6.80% |
| Bethesda, Maryland | Washington, D.C. | 290678 | 291025 | -0.10% | 1334020 | 1289680 | 3.40% |
| Manhattan Beach, California | Los Angeles | 290648 | 289872 | 0.30% | 3060289 | 3061514 | -0.04% |
| Lake Butler, Florida | Orlando, Florida | 289593 | 278972 | 3.80% | 283493 | 282374 | 0.40% |
| Ridgewood, New Jersey | New York City | 288861 | 286728 | 0.70% | 1174405 | 1090022 | 7.70% |
| Danville, California | Oakland, California | 284183 | 272988 | 4.10% | 2028939 | 2067645 | -1.90% |
| Needham, Massachusetts | Boston | 281049 | 276933 | 1.50% | 1586378 | 1568936 | 1.10% |
| Sammamish, Washington | Seattle | 280644 | 270527 | 3.70% | 1775255 | 1677194 | 5.90% |
| Vienna, Virginia | Washington, D.C. | 273768 | 274652 | -0.30% | 1206800 | 1147636 | 5.20% |
| Dix Hills, New York | New York City | 270581 | 271530 | -0.40% | 1107409 | 977324 | 13.30% |
| Colleyville, Texas | Fort Worth, Texas | 265831 | 264414 | 0.50% | 923032 | 907939 | 1.70% |
| Moraga, California | Oakland, California | 262781 | 268166 | -2% | 1771189 | 1839305 | -3.70% |
| Newton, Massachusetts | Boston | 261666 | 259631 | 0.80% | 1745616 | 1720939 | 1.40% |
| Brentwood, Tennessee | Nashville, Tennessee | 261248 | 260318 | 0.40% | 1419146 | 1347813 | 5.30% |
Key Indicators for Affluent Families
Several lessons emerge from the 2025 ranking of the safest and richest U.S. cities:
- Income and home values remain critical drivers. Cities with consistently high household incomes and appreciating real estate values continue to dominate the rankings.
- Safety defines long-term attractiveness. Communities with exceptionally low crime rates, such as Western Springs, Hinsdale, and Winchester, offer the most compelling blend of wealth and security.
- Regional diversification matters. From Illinois to California, and from Massachusetts to Texas, high-net-worth individuals have a diverse set of safe, affluent communities to choose from.
- Cost of living differentiates opportunity. While East and West Coast cities command higher living expenses, Midwest communities often provide comparable safety and prosperity at lower costs.
Why This Matters for Executives
For CEOs, CFOs, and ultra-wealthy families, location decisions often intersect with personal security, family lifestyle, and investment strategy. The safest and richest cities for 2025 offer more than prestige — they deliver stability, resilience, and a foundation for generational wealth. Whether it’s a hedge fund manager choosing Ridgewood, a venture capitalist in Mill Valley, or a Fortune 500 executive in Western Springs, the choice of residence is both a personal and financial decision.
Final Word
The 2025 CEOWORLD ranking of America’s safest and richest cities paints a clear picture: affluence without safety is incomplete, and safety without financial strength lacks resilience. Together, these 50 cities represent the best environments in the United States for wealth, security, and long-term prosperity.
For business leaders, policymakers, and investors, the lesson is clear: America’s most desirable communities are those that balance economic power, real estate value, and security, making them not just places to live, but places to thrive.
Have you read?
The Citizenship by Investment (CBI) Index evaluates the performance of the 11 nations currently offering operational Citizenship By Investment (CBI) programs: St Kitts and Nevis (Saint Kitts and Nevis), Dominica, Grenada, Saint Lucia (St. Lucia), Antigua & Barbuda, Nauru, Vanuatu, Türkiye (Turkey), São Tomé and Príncipe, Jordan, and Egypt.
Add CEOWORLD magazine as your preferred news source on Google News
Follow CEOWORLD magazine on: Google News, LinkedIn, Twitter, and Facebook.License and Republishing: The views in this article are the author’s own and do not represent CEOWORLD magazine. No part of this material may be copied, shared, or published without the magazine’s prior written permission. For media queries, please contact: info@ceoworld.biz. © CEOWORLD magazine LTD


